The 4th quarter data point provides an Anna Maria Island Real Estate 2025 year in review. Most of us are learning what life looks like after two major hurricanes I will say a surprise for me has been the slow rebound of both rental visitors as well as buyers for Anna Maria Island. I am happy to see 2025 leave us and am anxious to see 2026 get back to normal levels for all Anna Maria Island businesses. Below are results of 2025 as well as the 4th quarter.
Inventory for sale has elevated a small amount since Q3/2025. Q3/2025 ended at 296 AMI properties for sale and Q4/2025 increased to 309 which represents a 4% increase in inventory. Inventory absorption which is a relative leading indicator for supply and demand saw a slight increase from 11.0 months Q3/2025 versus Q4/2025 of 11.4 months. Our 10 year average inventory absorption is 8.1 months of inventory on hand. In summary, slightly above average supply with slightly below average demand. It is however important to note we have seen 12 months of flat supply versus demand.
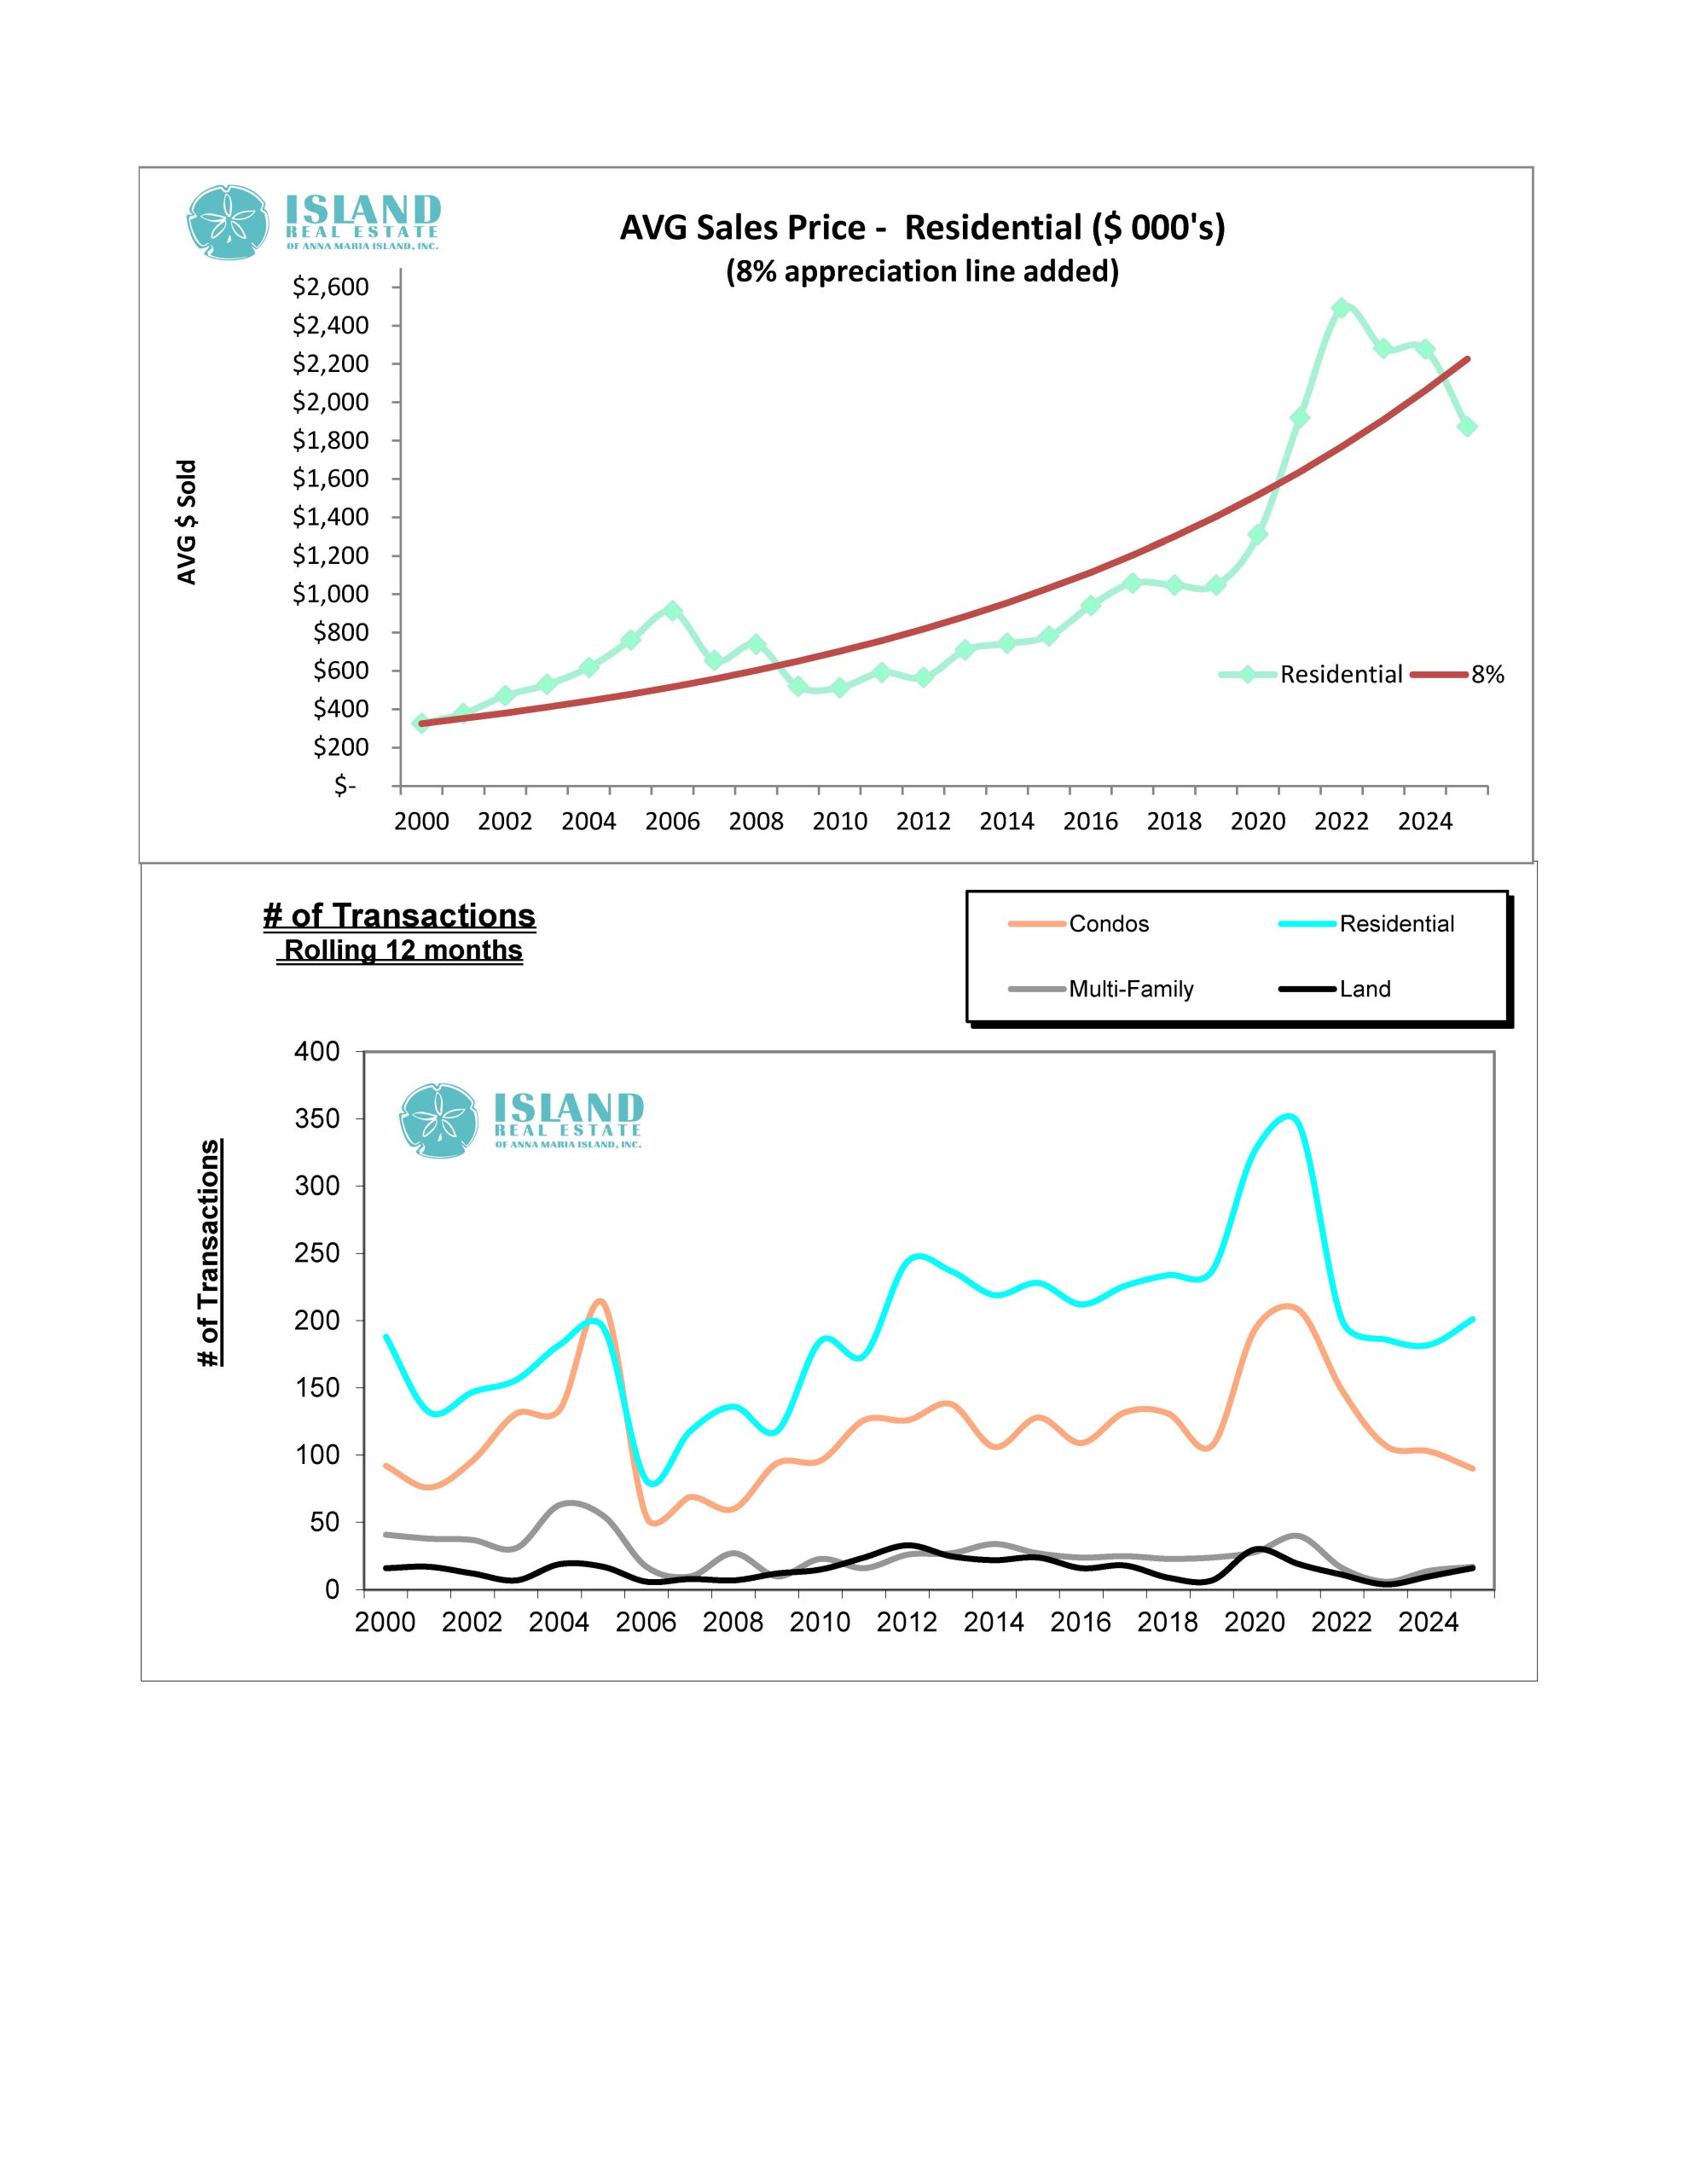
Q4/2024 vs Q4/2025 comparisons: Demand is up compared to last year, (51) Q4/2024 versus (81) Q4/2025 AMI property sold representing an increase in demand of 59%.
Q4/2025 sold data: The average sale pace for Q3/2025 was 27 per month. 21% of the sold properties Q4/2025 were above $2M as compared to Q3/2025 which was 25%. I was hoping we would see non-distressed sales increase closer to 30%. This tells us the market is moving from distressed buyers to those ready to make the leap. It’s important to keep an eye on this but if Q1/2026 pushes 30% of our total $2M+ sold properties our recovery of real estate values is on the way. Lastly, 22 condos were sold in all of Q4/2025 up from 15 in Q3/2025. 55% of condo sales were above $0.6 M which is a significant increase from Q3/2025 of only 20%.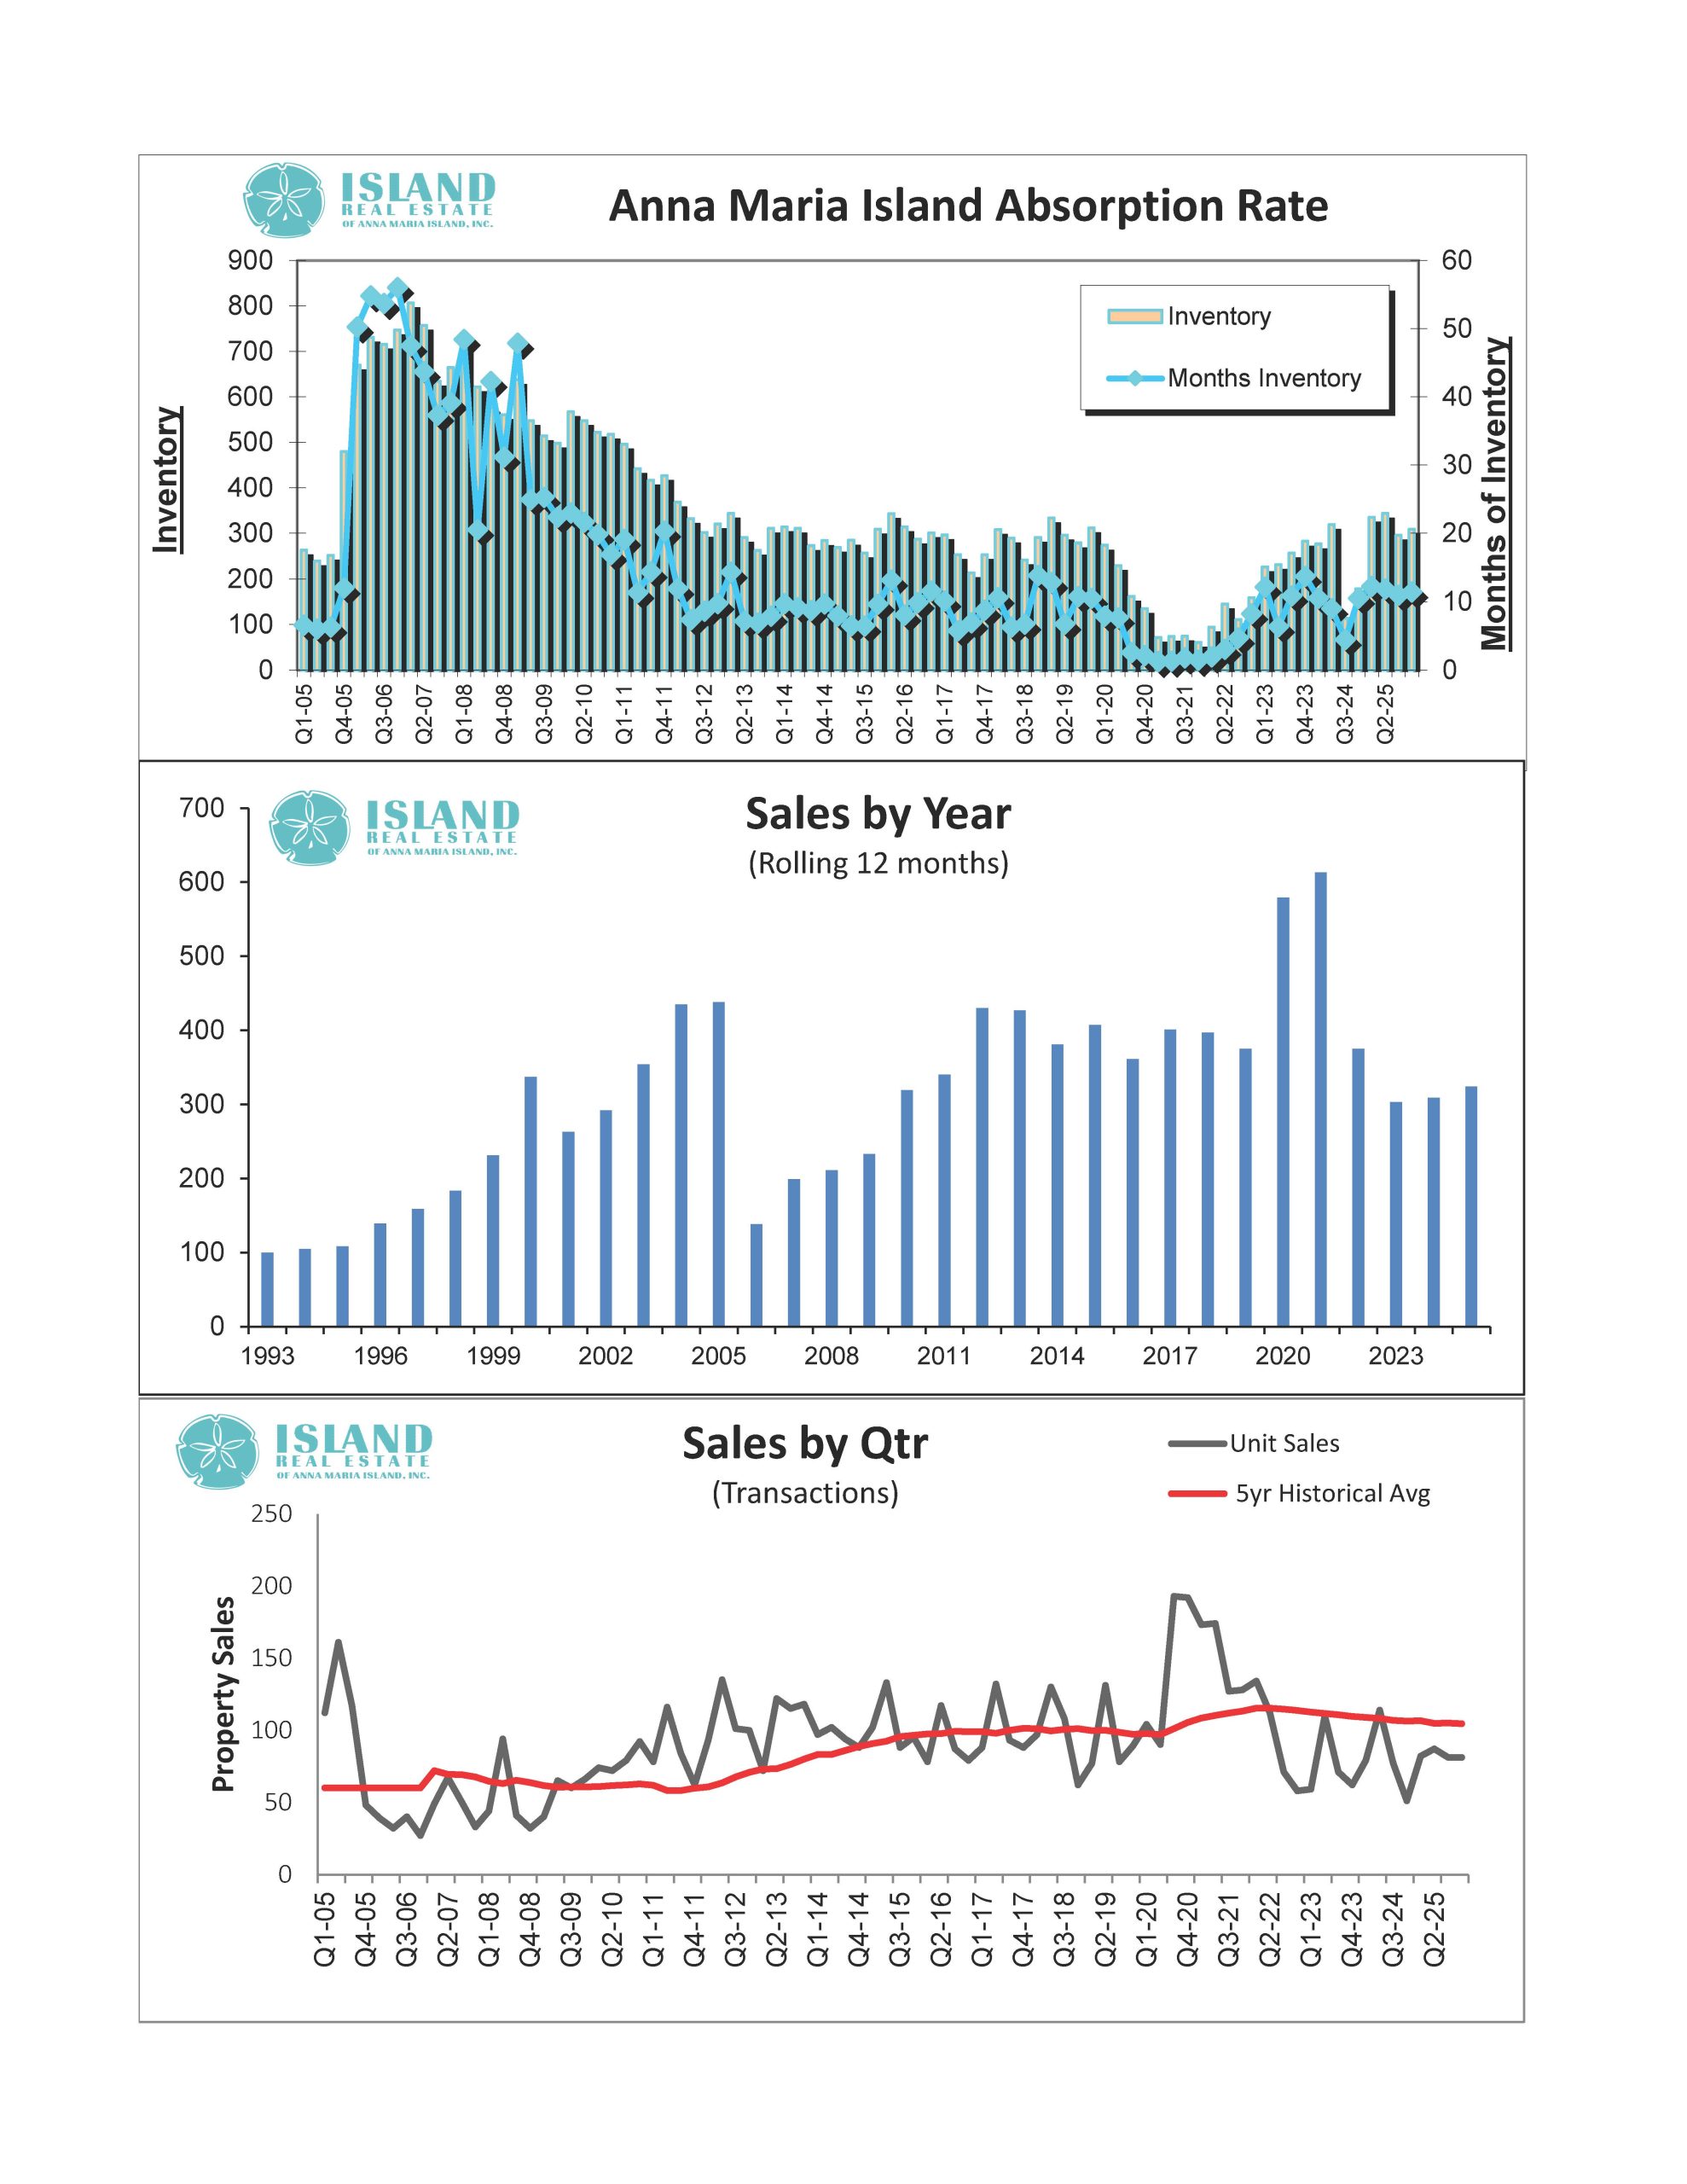
Last month Comparisons: In the month of December we saw 16 properties go pending. 25% of those had a list price of more than $2M. 44% of December pending were single family homes and 44% were condos. There were 29 properties sold in December 2025. 28% of the properties were above $2M and 66% of the properties were single family homes. Condos have seen an uptick in non-distressed properties selling on AMI.
Single Family for sale Data: The distribution of single-family properties for sale is 19%, $1M or less, 35% is $1M – $2M, 16% is $2M – $3M, 29% from $3M to $5M and above $5M is 14% of the AMI inventory for sale.
Condo for Sale Stats: The distribution of condos for sale are 19% under $0.5M, 57% from $0.5M to $1M, and 24% above $1M for sale.
Summary: Most of the data continues to point us to a buyer’s market for Anna Maria Island real estate. A small sign in the right direction is inventory for sale has remained flat, while Q4/2025 has seen a decrease in lower priced inventory in both single-family properties as well as condos. The difference in reduced low priced inventory is seen with an increase in the highest price range for both categories.
One last note for potential buyers. Q4/2024 at 51 properties sold is the worst demand quarter since the financial crisis in 2008 when we dipped to 32 properties sold. There is normally a LAG time between sellers understanding the market has shifted and prices dropping. The inventory shift mentioned above could be an indicator we are in the middle of a low market price reality for sellers. In addition, the vacation rental market demand for Q1/2026 is healthy and close to “normal” demand levels. While I don’t have a crystal ball, my guess is Q2/2026 is when we can expect a turn in the market DATA. If you have been on the sidelines waiting for the moment to buy, I would strongly suggest making some offers to see if you can pick up your dream AMI property in Q1/2025.
HAPPY NEW YEAR! Larry Chatt and the Galletto Team