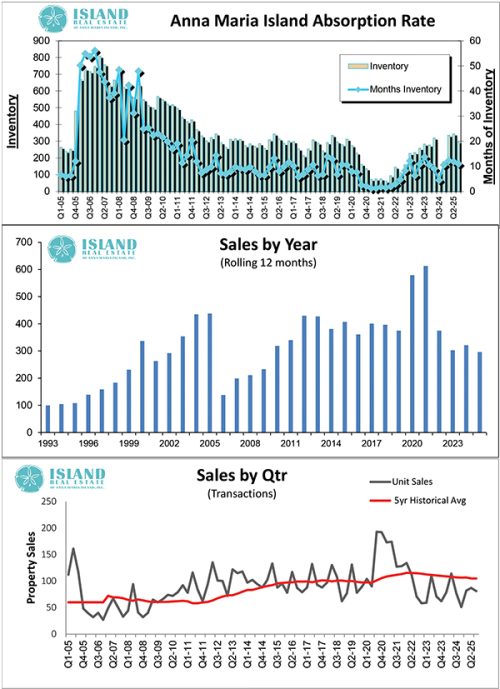
Inventory for sale has dropped for the first time since our windy season. Q2/2025 ended at 344 AMI properties for sale and Q3/2025 we dropped to 296 which represents a 14% reduction in inventory. Inventory absorption, which is a relative leading indicator for supply and demand, saw a slight reduction from 11.9 months Q2/2025 versus Q3/2025 of 11.0 months. Our 10-year average inventory absorption is 7.9 months of inventory on hand. Clearly correlates with what we are seeing in the market. Slightly above average supply with slightly below average demand. However, it is important to note that we have seen 9 months of flat supply versus demand.
Q3/2024 vs Q3/2025 comparisons: Demand is up compared to last year, (77) Q3/2024 versus (81) Q3/2025 AMI property sold. Most notably, demand is up 59% from our low of 51 Q4/2024 versus Q3/2025 of 81.
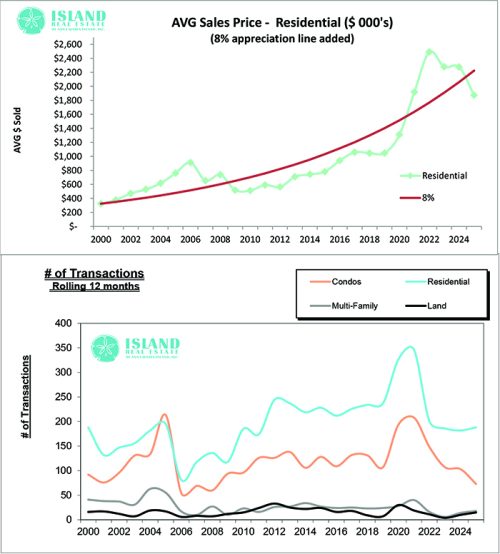
Q3/2025 sold data: The average sale pace for Q3/2025 was 27 per month. 25% of the sold properties Q3/2025 were above $2M as compared to Q2/2025, which was 15%. I am excited that the volume of property sold above $2M has increased to 25%. This is the beginning of an indicator of a healthy market after our windy storms of 2024. It’s important to keep an eye on this, but if Q4/2025 pushes 30% of our total $2M+ sold properties, our recovery of real estate values is on the way. Lastly, 15 condos were sold in all of Q3/2025 down from 21 in Q2/2025. Only 20% of sales in Q3/2025 were above $0.6M.
Last month Comparisons: In the month of September, we saw 20 properties go pending. 20% of those had a list price of more than $2M. 60% of September pending were single-family homes, and 30% were condos. There were 21 properties sold in September 2025. 19% of the properties were above $2M, and 62% of the properties were single-family homes. This continues my thoughts that we are in a mixed market with a slight decrease in distressed property buyer’s market, which will likely continue until December 2025.
Single Family for sale Data: The distribution of single-family properties for sale is 12%, $1M or less, 29% is $1M – $2M, 23% is $2M – $3M, 23% from $3M to $5M and above $5M is 13% of the AMI inventory for sale. Condo for Sale Stats: The distribution of condos for sale are 27% under $0.5M, 60% from $0.5M to $1M, and 13% above $1M for sale.
Summary: Most of the data continues to point us to a buyer’s market for Anna Maria Island real estate. Inventory holding steady for 9 months, as well as 25% of properties Q3/2025 sold above $2M. This is a glimpse that sellers are becoming more understanding of market conditions, and sellers motivated to sell are reducing their prices. If you are considering purchasing something on Anna Maria Island, I would suggest to start watching the market. With continued reductions in interest rates expected as well as no windy storms this season, I anticipate the market could turn hot for single-family properties under $2.5M and Condos under $1.1M.
It’s hard to believe that 1 year ago, the island was ravaged by two hurricanes. Recently, I reflected on life after hurricanes and told my youngest son, “I hope in 50 years you are celebrated for your first-hand recollection of what it was like to live on Anna Maria Island during Helen and Milton.” He asked why? “This would mean Islanders are not posed for 50 years with the question, is the risk versus the reward?” Thanks – Larry Chatt